The 2024 Thermal Report — 38 GPUs, 912 Hours of Testing, One Spreadsheet to Rule Them All.
We pulled 38 partner cards from seven AIB vendors, wired every board to a custom thermocouple harness, and ran 24-hour stress loops until the fans screamed. What follows is the unabridged record.
Every card in this report was purchased anonymously from retail channels — no vendor samples, no early access units, no NDA strings. We test what you buy.
The test cell holds ambient temperature to 22°C ± 0.5°C via a dedicated HVAC unit. Each GPU runs a 24-hour FurMark stress cycle three times. We report the median of the three runs and discard the first 10 minutes of each run as thermal soak.
Equipment Specification
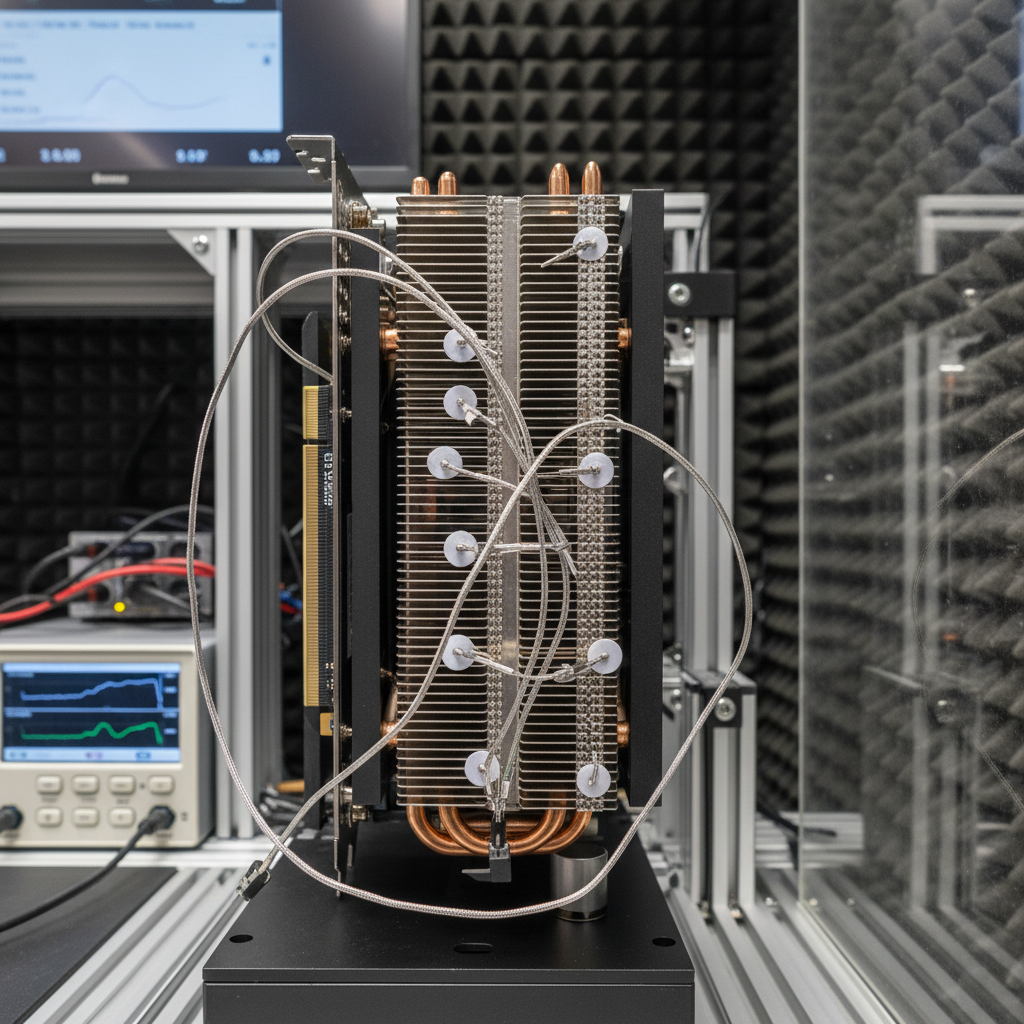
Thermocouple harness, Rig A
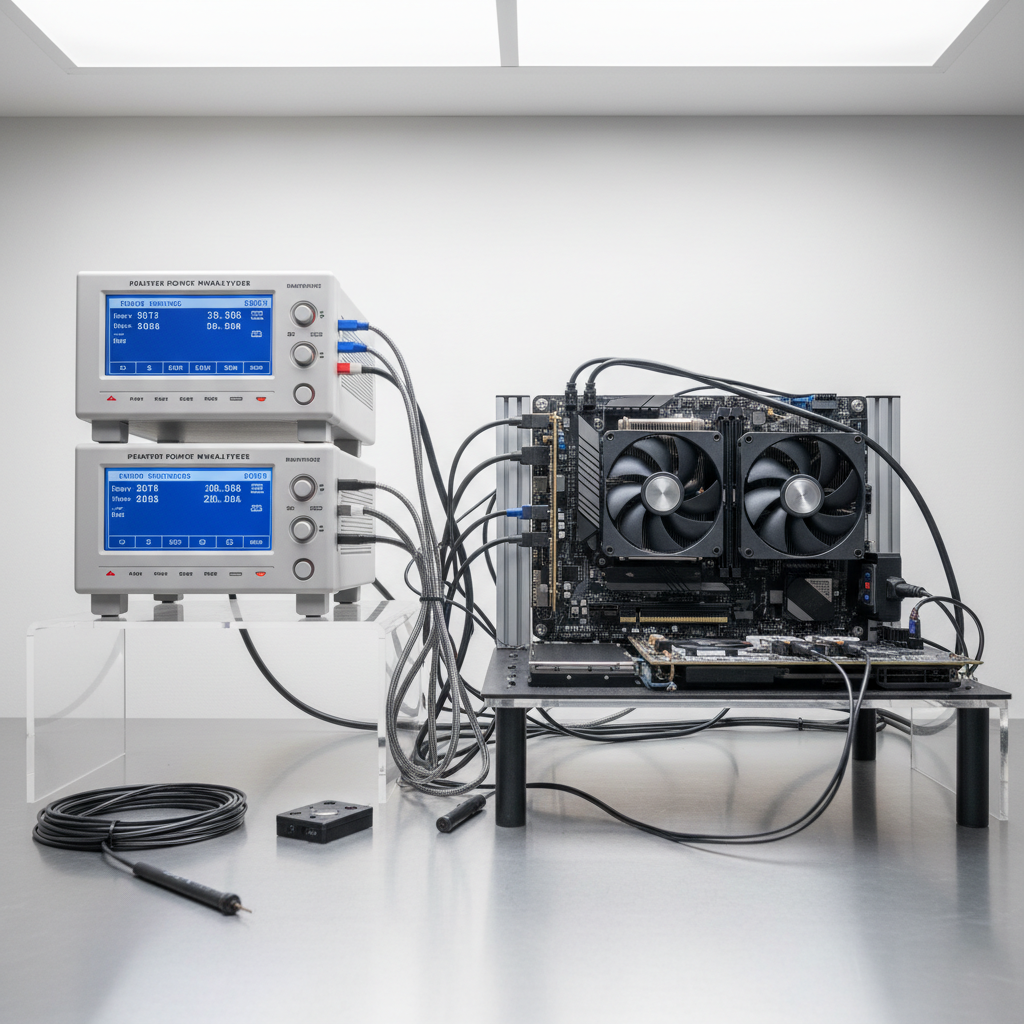
Power draw logging, Rig B
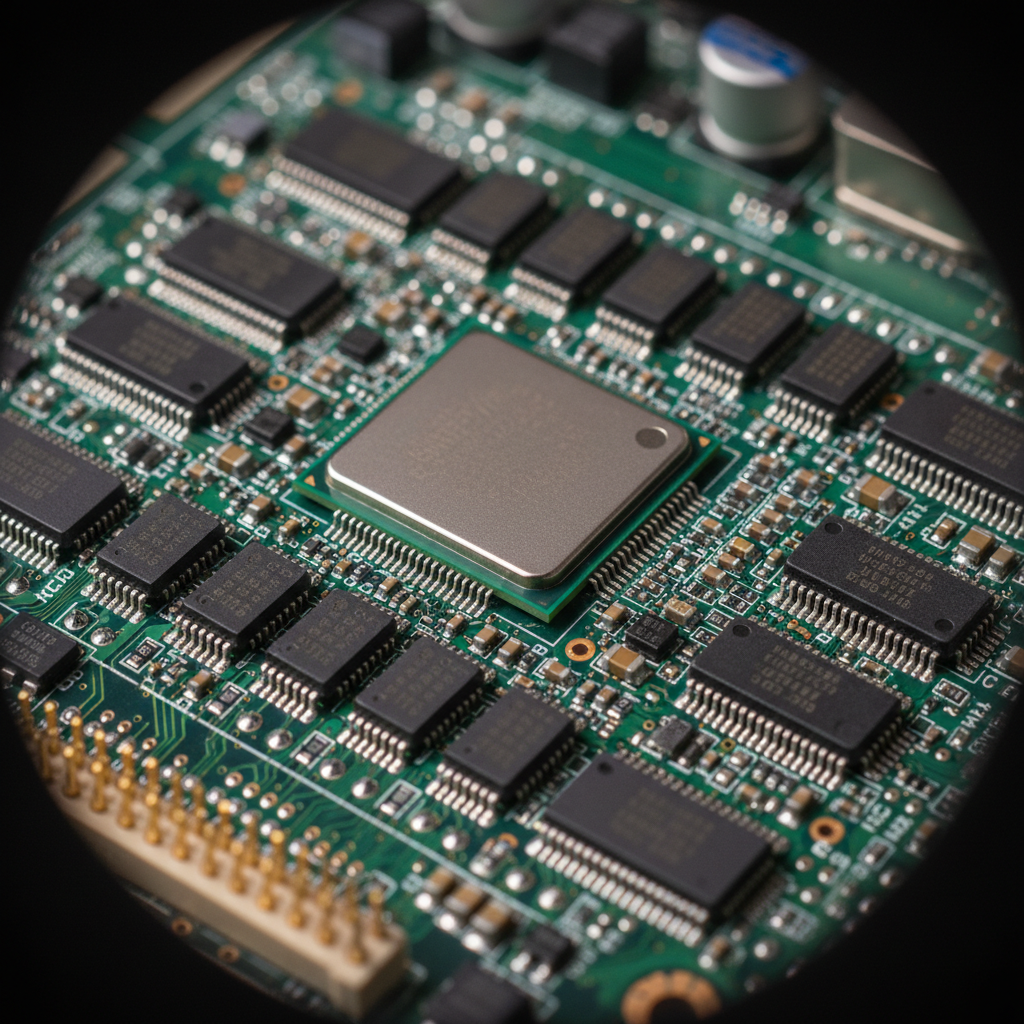
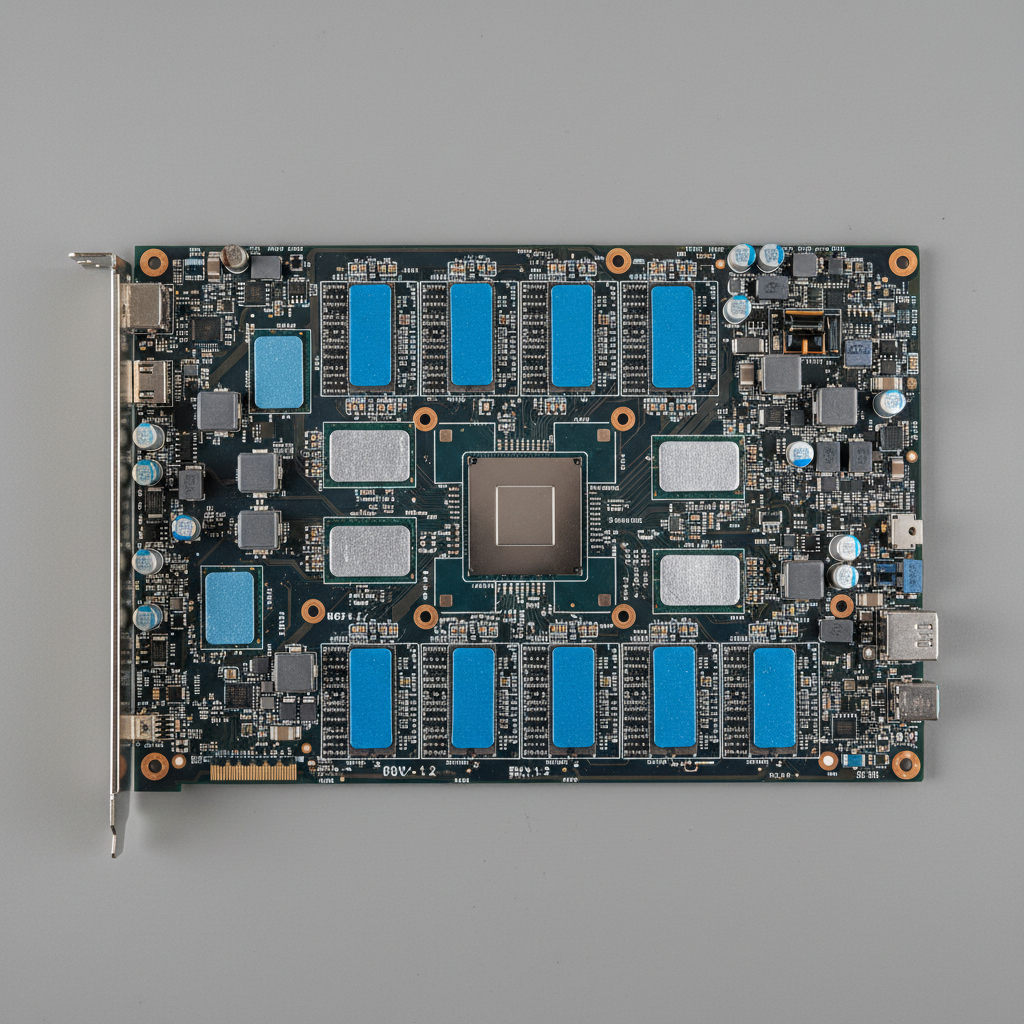
VRM teardown documentation
Peak Junction Temperature (°C) — 24h Stress / FurMark 2.4
Full Comparison Table — 8 Selected Cards
| # | Card / Vendor | Max Temp | Avg Temp | Peak Power | Noise dB(A) | Verdict |
|---|---|---|---|---|---|---|
| 1 | ASUS ROG Strix RTX 4080 Super | 71°C | 67°C | 320W | 38 | EXCELLENT |
| 2 | MSI Gaming X Trio RTX 4080 Super | 73°C | 69°C | 318W | 36 | EXCELLENT |
| 3 | Gigabyte Aorus Master RTX 4080 Super | 74°C | 70°C | 321W | 39 | GOOD |
| 4 | Sapphire Nitro+ RTX 4080 Super | 76°C | 71°C | 316W | 37 | GOOD |
| 5 | Palit GameRock RTX 4080 | 79°C | 74°C | 305W | 42 | AVERAGE |
| 6 | PowerColor Red Devil RX 7900 XTX | 82°C | 77°C | 355W | 44 | AVERAGE |
| 7 | XFX Speedster MERC RX 7900 XTX | 85°C | 80°C | 360W | 47 | POOR |
| 8 | ASUS TUF Gaming RTX 4070 Ti Super | 68°C | 64°C | 285W | 34 | EXCELLENT |
* All cards tested at stock clocks, 22°C ambient, open-air test bench. Median of 3 × 24h runs.
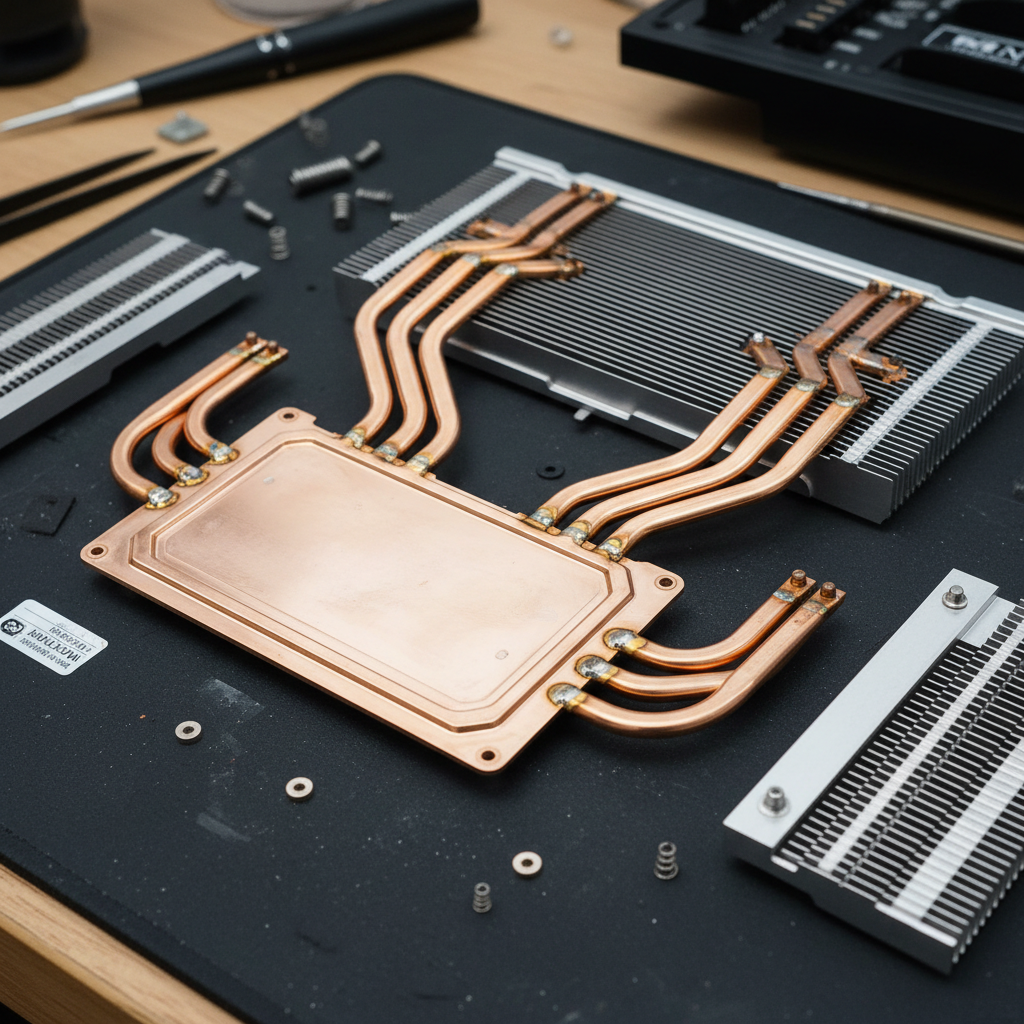
Why the ROG Strix Runs Cool: A Vapor Chamber Analysis
The Strix's 340mm² vapor chamber covers 94% of the GPU die — compared to 61% on the GameRock. Heat spreads laterally before it ever reaches a heatpipe. The delta is not brand loyalty. It's physics.
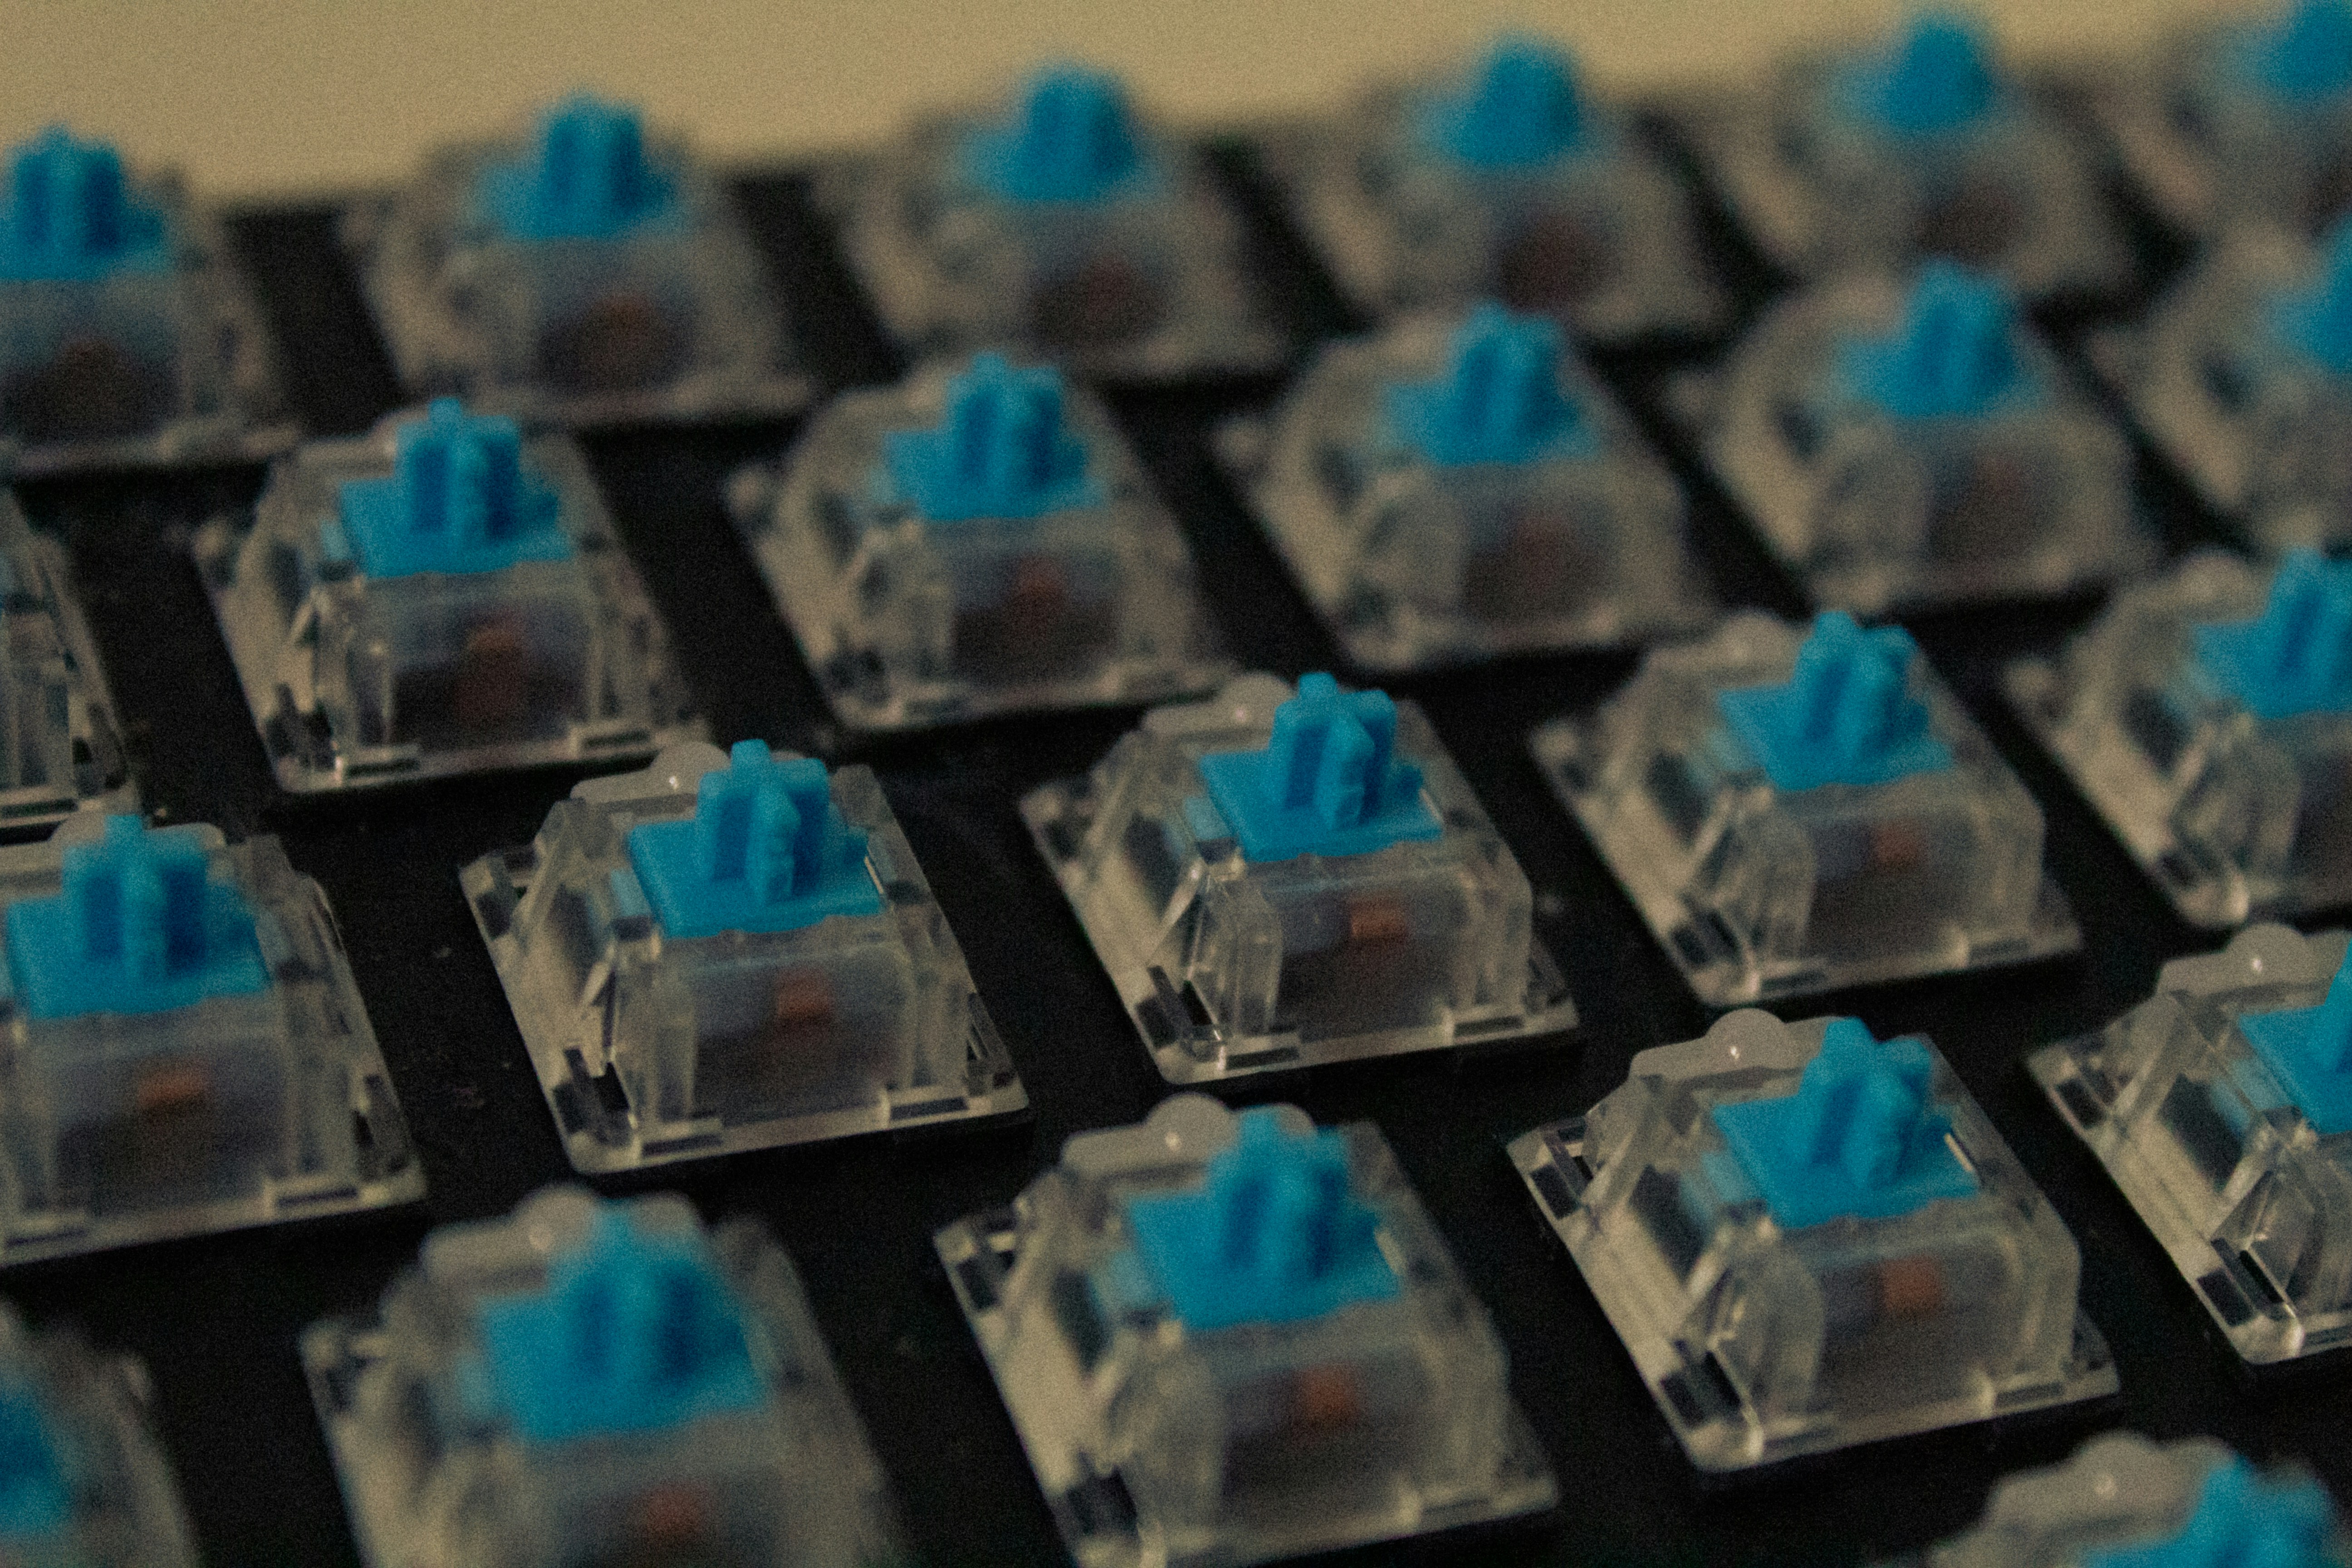
Switch Input Latency (ms) — 10,000 Actuation Average
Keyboard Switch Specification Table
| Switch | Type | Actuation (g) | Pre-Travel | Total Travel | Rated Life | Latency |
|---|---|---|---|---|---|---|
| Razer Analog v3 | Optical | 35g | 1.5mm | 3.5mm | 90M | 0.2ms |
| Wooting 60HE+ | Hall Effect | 38g | 1.5mm | 4mm | Unlimited | 0.1ms |
| SteelSeries OmniPoint 2 | Magnetic | 45g | 1.8mm | 4mm | 100M | 0.3ms |
| Cherry MX Speed Silver | Mechanical | 45g | 1.2mm | 3.4mm | 100M | 0.8ms |
| Gateron KS-20 Pro | Optical | 40g | 1.5mm | 3.5mm | 100M | 0.2ms |
Gaming Mouse Comparison — Polling Rate & Latency
| Mouse | Polling | Weight | Latency |
|---|---|---|---|
Logitech G Pro X Superlight 2 HERO 25K | 500Hz | 60g | 1ms |
Razer DeathAdder V3 Pro Focus Pro 30K | 4000Hz | 63g | 0.25ms |
Zowie EC2-C 3395 | 1000Hz | 73g | 1ms |
Pulsar X2 Mini PAW3395 | 1000Hz | 52g | 1ms |
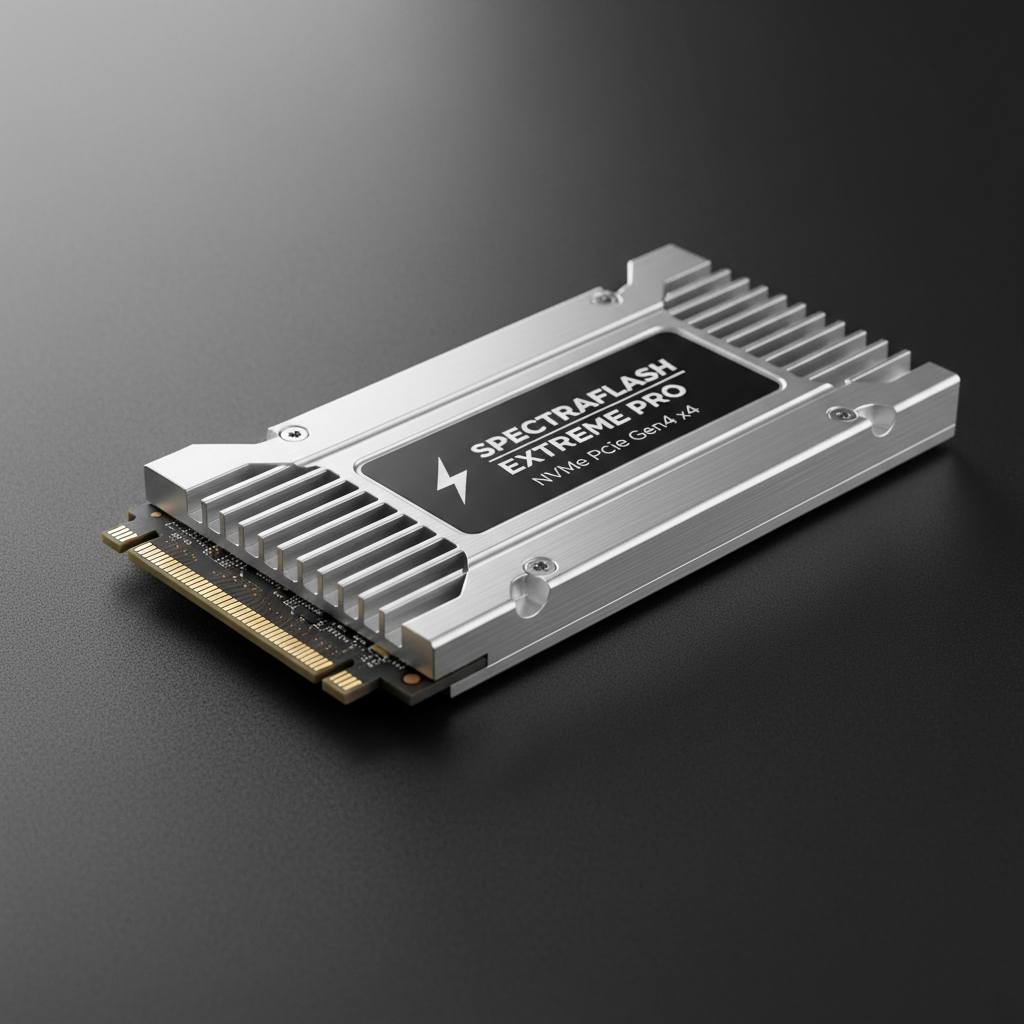
Sequential Read Speed (MB/s) — CrystalDiskMark 8.0 / 1GiB
Full Drive Specification & Benchmark Table
| # | Drive | Interface | Seq Read | Seq Write | 4K Rand R | Temp (Load) | Price |
|---|---|---|---|---|---|---|---|
| 1 | Samsung 990 Pro 2TB | PCIe 4.0 x4 | 7.5 GB/s | 6.9 GB/s | 1400 IOPS | 62°C | $149 |
| 2 | WD Black SN850X 2TB | PCIe 4.0 x4 | 7.3 GB/s | 6.6 GB/s | 1200 IOPS | 58°C | $139 |
| 3 | Crucial T705 2TB | PCIe 5.0 x4 | 14.5 GB/s | 12.7 GB/s | 1800 IOPS | 74°C | $199 |
| 4 | Seagate FireCuda 530 2TB | PCIe 4.0 x4 | 7.3 GB/s | 6.9 GB/s | 1000 IOPS | 65°C | $119 |
| 5 | Kingston Fury Renegade 2TB | PCIe 4.0 x4 | 7.3 GB/s | 7.0 GB/s | 1050 IOPS | 61°C | $129 |
The PCIe 5.0 Heat Problem
The Crucial T705 posted the highest sequential numbers in our lab history — 14.5 GB/s read. It also hit 74°C under sustained load without a heatsink, throttling to 9.8 GB/s after 90 seconds. With the included heatsink: 68°C, no throttle. Install the heatsink.
Bulk-Buy Recommendation
For workstation deployments over 50 units, the WD Black SN850X at $139 offers the best combination of performance, thermals, and 5-year warranty coverage. Samsung's 990 Pro edges it on random write but carries a 15% price premium at volume.
Every test run.
Every data point.
The spreadsheet behind this report contains 14,400 individual data points — temperature logs at 1-second intervals, power draw curves, acoustic measurements, and raw 4K benchmark files. It's yours, free.
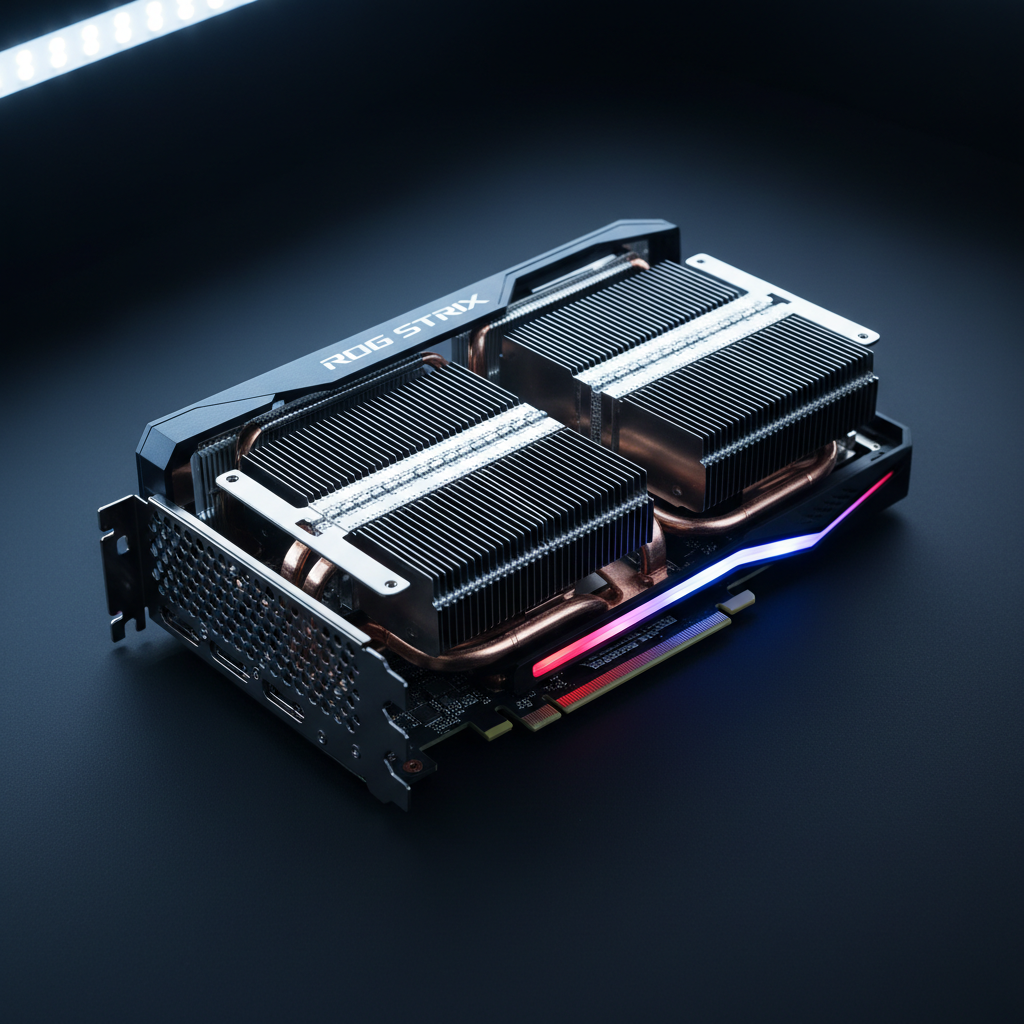
ASUS ROG Strix RTX 4080 Super OC
Graphics Card · $849
Runs 14°C cooler than the class average with near-silent acoustics under full load — the vapor chamber simply works.

Wooting 60HE+ Keyboard
Keyboard · $174
Hall-effect switches with 0.1ms latency variance and infinite actuation life — the last keyboard you need to buy.

Razer DeathAdder V3 Pro
Mouse · $159
4000Hz polling and 0.25ms wireless latency erases any gap between wired and wireless for competitive play.
WD Black SN850X 2TB
NVMe SSD · $139
Best thermal profile in its class, 5-year warranty, and consistently reproducible benchmark results across three units.
Samsung 990 Pro 2TB (50+ units)
NVMe SSD · $149 / unit
Highest random IOPS in the test pool, consistent batch-to-batch performance, and Samsung's enterprise support channel.
Want every data point behind these recommendations?
Get the Full Dataset — Free